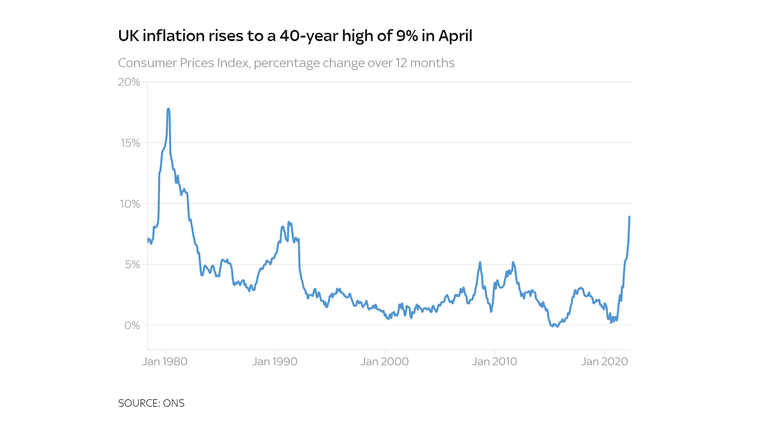
UK inflation hit a forty-year high in April as a result of surging housing and energy costs.
Prices increased 9% over the past year, according to new data from the Office for National Statistics.
If you haven’t had a pay rise recently, this means your wages are worth almost a tenth less than they were a year ago.
So, what is pushing up prices?
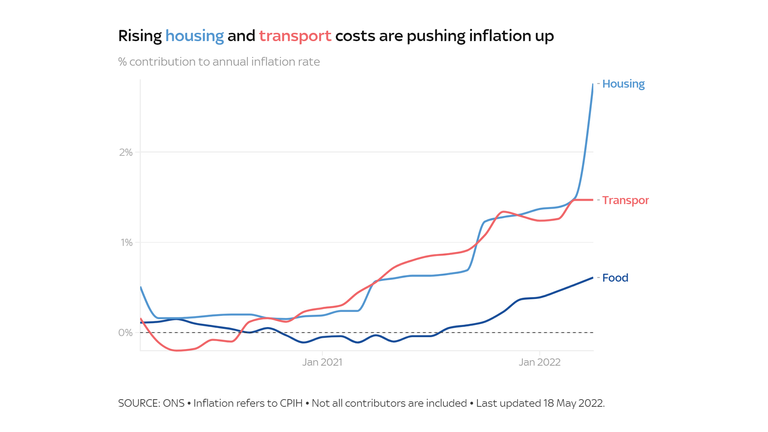
The largest contributors to inflation are housing and transport costs, which have been rising for the past year and a half.
In April, these numbers were bolstered by an increase in the energy price cap and the annual rise in rents for social housing.
Together they account for more than half of the headline inflation number.
Are businesses ripping us off?
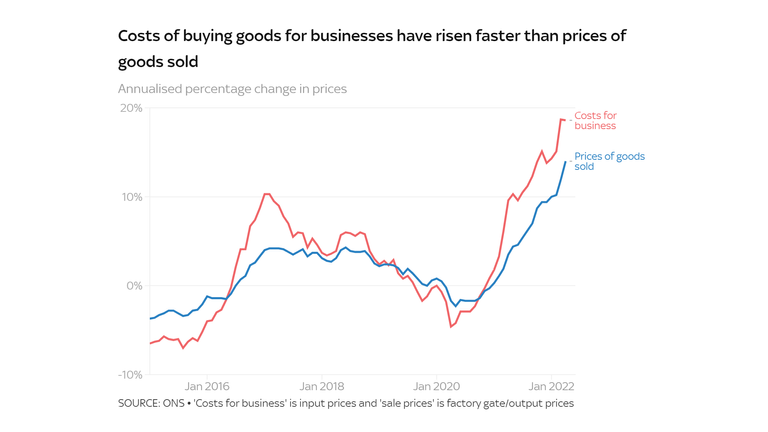
High inflation could suggest businesses are heavily marking up products to make more profit.
But this is not the case, as businesses actually face faster price rises than consumers do.
Costs for businesses rose by 18.6% for the year to April, while the prices they sold at rose by 14%. These high input prices could fuel inflation later on this year.
Is there more pain to come?
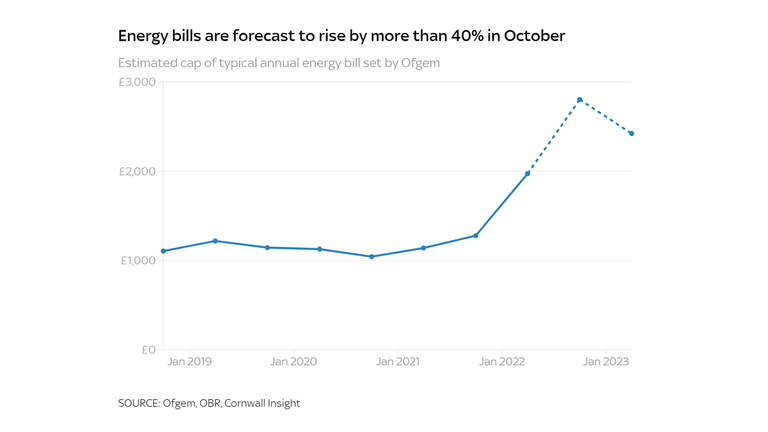
Prices are expected to rise even more. The Bank of England forecasts that inflation will reach 10% by the end of this year.
One of the main reasons for this is further increases in the energy price cap, which went up almost £700 last month.
In October, it is expected to rise 42% to £2,801.
Poorer households will be affected the most as they spend a larger proportion of their income on energy bills.
The bottom 10% of households currently face an inflation rate of 10.9%, three percentage points higher than the top 10%, according to the Institute for Fiscal Studies (IFS).
Heidi Karjalainen, research economist at the IFS, says that poorer households will continue to be worse off.
“State benefits only increased by 3.1% in April. This means big real terms cuts to the living standards of many of the poorest households.
“We are likely to be in a prolonged period during which poorer households are facing rates of inflation even higher than the headline figures would suggest.”
Read more: See how much your spending has increased Five ways the cost of living crisis could be eased
The Data and Forensics team is a multi-skilled unit dedicated to providing transparent journalism from Sky News. We gather, analyse and visualise data to tell data-driven stories. We combine traditional reporting skills with advanced analysis of satellite images, social media and other open source information. Through multimedia storytelling we aim to better explain the world while also showing how our journalism is done.